
What is forensic economics?
In a litigation setting, forensic economics refers to the application of economic theories and methods to detect and estimate economic damage. But in academia, forensic economics extends beyond individual litigation cases to a broader analysis of illegal/unethical conduct. In the following, I provide a broad overview of forensic economics in academia. If you want to dive into one specific conduct, you can read about backdating of executive stock options here.
Two broad techniques
Researchers use two broad techniques to uncover systematic illegal/unethical conduct. Benchmarking entails comparing data for one group where misconduct is suspected to benchmark data clean of misconduct (or at least less susceptible to misconduct). Distribution validation entails an analysis of the distribution of the data for a group where misconduct is suspected in search of suspicious patterns, and it is often visually striking. Both techniques require lots of data, and neither is very good at proving misconduct in individual cases. Confused? I figured, so let me illustrate with examples.
Benchmarking
Lottery cheating
Playing the lottery is a game of chance, right? Perhaps not entirely. There is anecdotal evidence that clerks at lottery retailers cheat by, e.g., stealing winning tickets from customers. After several lottery scandals in Canada, Jeff Rosenthal at the University of Toronto compared the winnings of clerks to winnings in the overall population. Clerks represent maximum one percent of the population, and they spend up to 50% more on lottery tickets than others. Thus, clerks should get up to 1.5% of lottery winnings. But the data show that clerks get 3.5% of major winnings. The conclusion is that more than half of clerks’ major winnings are fraudulent, but we cannot tell which without a closer investigation.

Stock analyst misconduct
Stock analysts value stocks and offer recommendations ranging from a strong sell (if a stock is greatly overpriced) to a strong buy (if a stock is greatly underpriced). But analysts face conflicting incentives. On the one hand, they wish to provide accurate recommendations to display their skills and enhance their reputation. On the other hand, they wish to please executives at the firms they analyze, because these executives regularly buy investment banking services from the analysts’ employers. This results in a bullish bias, in which analyst recommendations are, on average, leaning toward buy, whereas sell recommendations are less common.
Alexander Ljungqvist, Christopher Malloy, and Felicia Marston uncovered another troubling behavior arising from analysts’ incentives. They found that analyst recommendations in a commonly used database were often changed the year after they were originally reported. One possibility is that these changes were the result of innocuous mistakes. An alternate possibility is that many of the changes were made to hide bullish bias, especially for stocks that subsequently performed poorly.
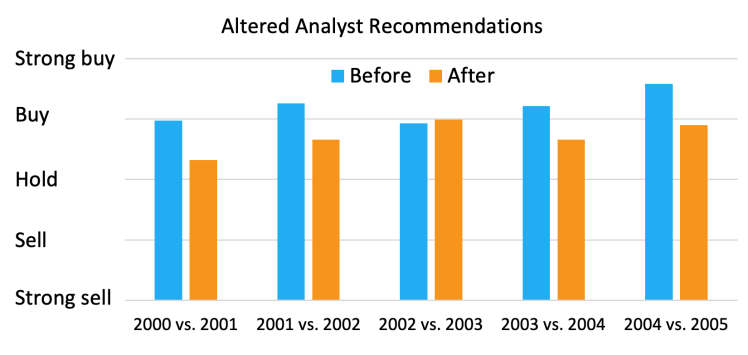
Benchmarking the changed analyst recommendations against the original recommendations, the researchers found evidence that many of the changes must have been made to hide bullish bias. The graph below compares the average original recommendation to the average changed recommendation the year thereafter. There is strong evidence for four of the five years that the analyst recommendations were lowered on average, consistent with systematic misconduct.
Collusion among stock dealers
We are used to stock prices and product prices in decimals, e.g., $1.99 for a soda bottle. But before 2000, US stock exchanges traded stocks in eights – with the minimum price increment being $1/8 = $0.125 – so that a stock could sell for $10, $10.125, $10.25, etc. This effectively made the spread – the difference between what stock dealers would buy and sell stock for, and implicitly a trading cost for investors – at least $0.125. Those were indeed lucrative times to be a stock dealer. But it appears that this was not enough for dealers at the NASDAQ exchange…
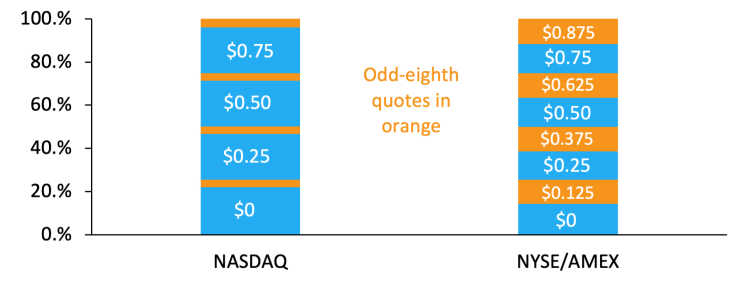
In the early 1990s, researchers Bill Christie and Paul Schultz documented that the stock prices from NASDAQ typically ended in zero or even eights (2/8, 4/8, 6/8), while prices ending in odd eights (1/8, 3/8, 5/8, 7/8) were largely missing. This distribution itself was puzzling (more on distribution validation later), and using the distribution NYSE/NASDAQ as a benchmark, the lack of odd eights is clearly abnormal, as the graph below illustrates. Christie and Schultz concluded that NASDAQ dealers must have colluded by avoiding odd eights to keep the spreads to a minimum of one quarter. Imagine making a full quarter for each time you buy and sell a single stock! Were Christie and Schultz correct? I think we can safely say yes. As soon as they reported their results, the odd eights returned, and legal settlements for over one billion dollars followed.
Distribution validation
Earnings manipulation
Firms manipulate earnings in a variety of ways and for a variety of reasons. One reason is that managers do not wish to report losses, because it reflects poorly on their leadership. Thus, if executives discover that their firm has recently been unprofitable, even by just a little, they might look for ways to fudge the reported earnings to conceal the problems.
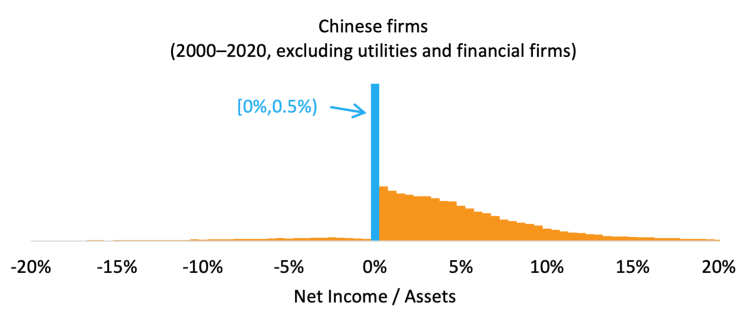
In the absence of earnings manipulation, we would expect that reported earnings for a large sample of firms would make a smooth and bell-shaped distribution. The graph below shows the distribution of reported earnings for Chinese firms. Does it strike you as strange? To me, the low frequency of negative earnings and the high frequency just above zero is highly suspicious. In fact, I am inclined to conclude that Chinese firms manipulate earnings on a grand scale to avoid reporting losses.
Teacher-cheating
Students often take standardized tests, and the outcome of those tests can have consequences for both students and teachers. Thus, if the teachers grade their own students’ tests, they often have the incentive to tamper with the answers.
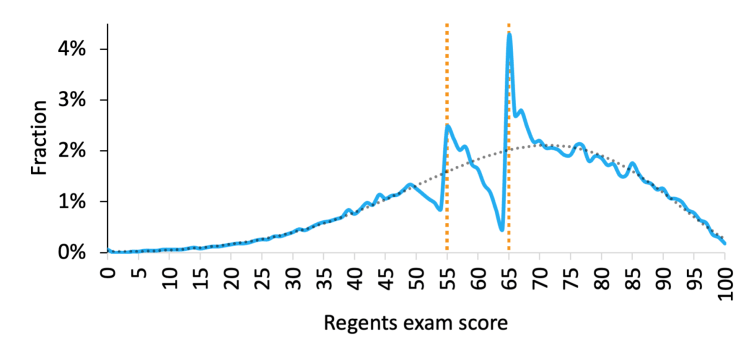
Thomas Dee, Will Dobbie, Brian Jacob, and Jonah Rockoff got data from the New York State Regents Examinations in search of tampering. The exams had proficiency cutoffs; students who scored at least 65 of 100 would receive the Regents diploma, whereas those who scored at least 55 might receive a local diploma. The graph below shows the distribution of scores. There is a huge spike at exactly 65 points, and another more modest spike at 55 points. Furthermore, there appear to be missing scores immediately below the 65- and 55-cutoffs. Based on this distribution, the researchers estimated that 40% of exams right below the proficiency cutoffs were manipulated, representing 6% of all exams.
Restaurant inspections
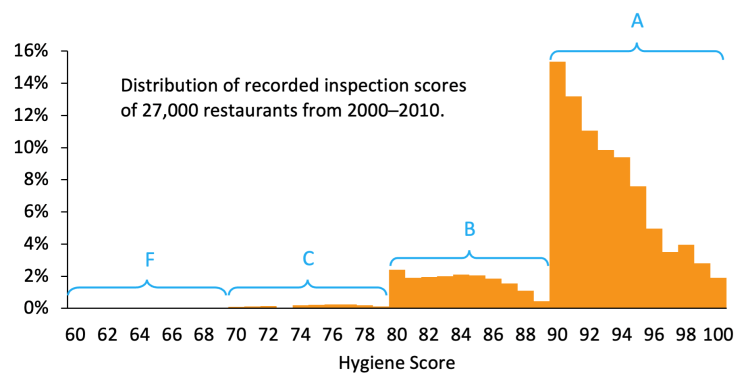
Restaurants are routinely inspected for hygiene to minimize cases of food-borne illnesses and improve public health. The numerical hygiene scores are translated into letter grades like those used in the school system, which are displayed in a window of the restaurant. Customers perceive a letter grade of A to be a certification of food safety and are more likely to visit such restaurants.
Balázs Kovácsa, David Lehman, and Glenn Carroll examined the distribution of more than 300,000 hygiene scores from 2000 to 2010 by the Los Angeles Department of Public Health (LADPH). The figure below shows the distribution of the hygiene scores. Impartial inspections should yield a continuous distribution. Instead, we see discontinuous jumps between 79 and 80 points and between 89 and 90 points, precisely the places that separate the letter grades C and B and the grades B and A, respectively. Thus, a suspiciously high number of restaurants on the borderlines received scores that were just enough to secure either an A or a B.
The authors also found that grade inflation was more likely for repeated interactions, i.e., when an inspector had visited the same restaurant before. Perhaps the inspectors became friendly with the restaurant-owners over time and wished to help in small ways when they could. Or perhaps there was plain old bribery or corruption involved. I lean toward the former, and less perturbing, possibility.
The problem solver
While forensic economics might be unable to pinpoint the exact culprits of misconduct, it can help identify systematic problems. Once a problem is exposed, it sometimes evaporates, like sunshine on mold. (The stock dealer collusion is a good example of that.) And if not, we can alter the incentives or setting that facilitated the misconduct. (For example, lotteries could forbid clerks from participation.)
Want to learn more? Then the books Catching Cheats and Data Diving will be of interest.
